
viewer.md 8.8 KB
title: Reading Your Graph in the Browser
description: codegraph ui opens a local viewer for an indexed project — callers, source, and callees on one screen.
codegraph ui opens a viewer for a project you have already indexed. It is the same graph your agent reads, on screen.
codegraph init          # once per project, if you haven't already
codegraph ui            # opens http://127.0.0.1:4747 in your browser
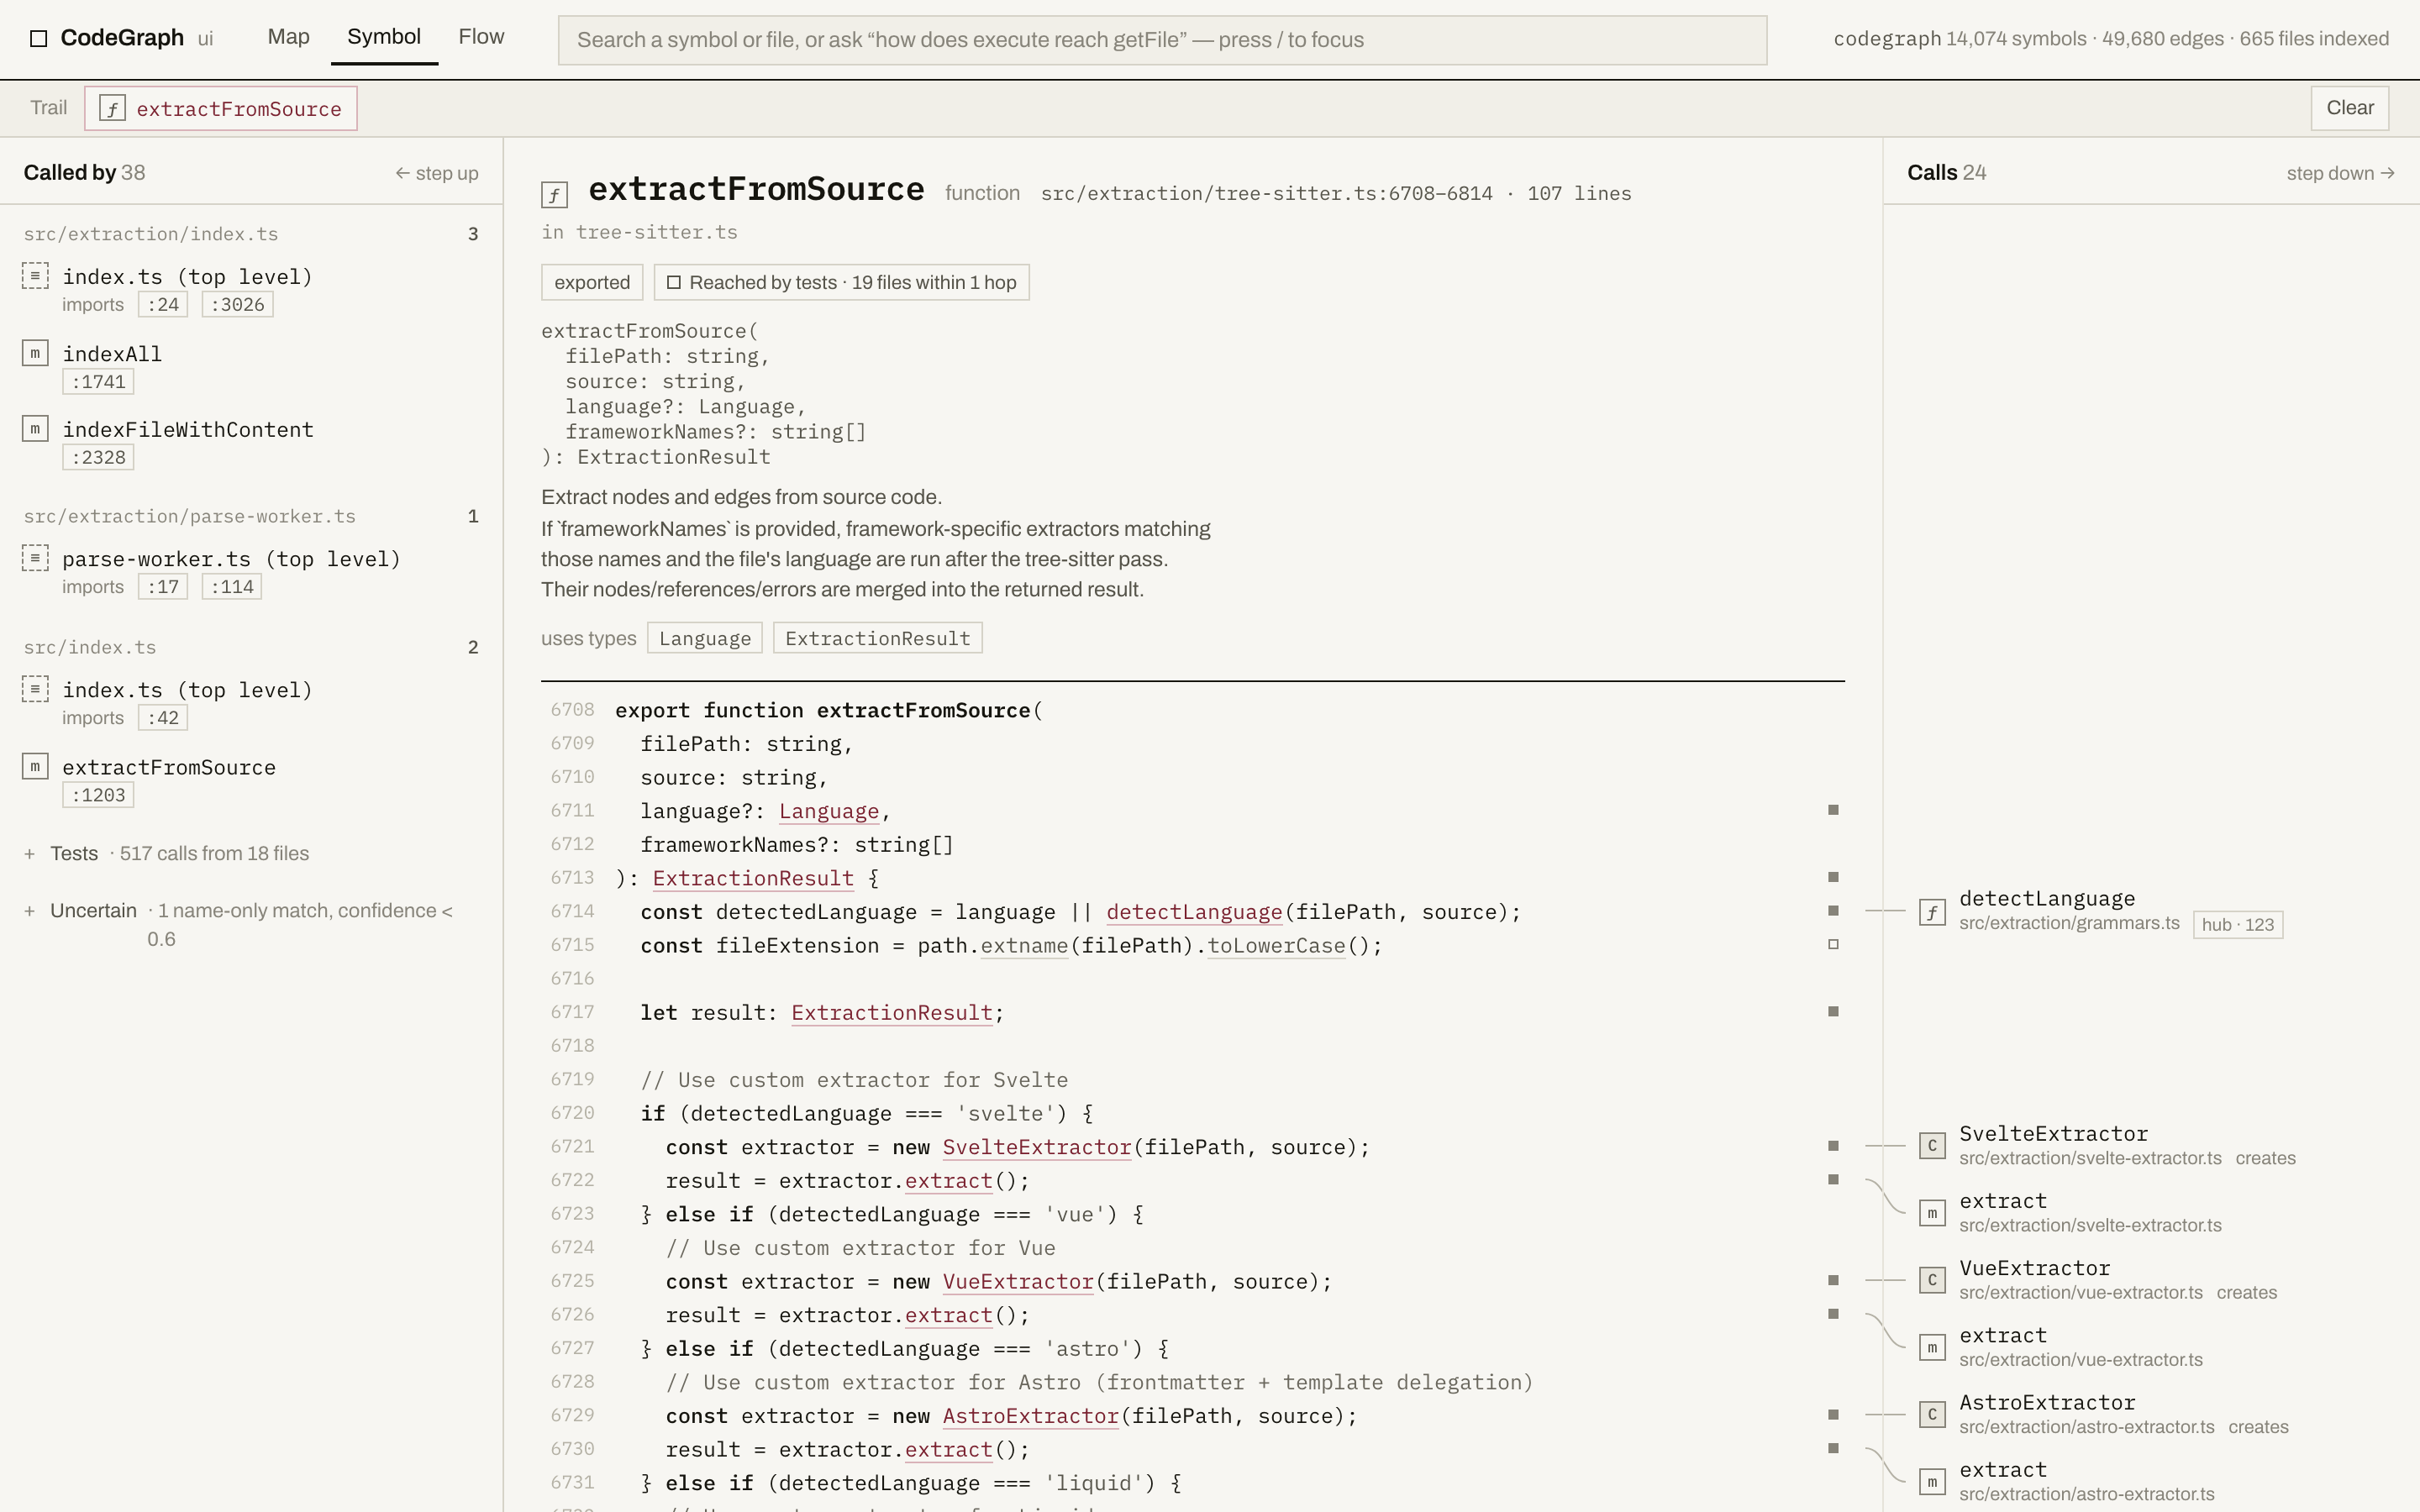
The symbol screen
Pick a symbol and you get three columns that all describe the same thing:
- Called by, on the left, grouped by file, each caller carrying the exact line it calls from. Click a line number to open that caller scrolled to the call. Test callers fold into a single line so real callers stay in view.
- The source, in the middle, verbatim from disk and syntax-highlighted, with a marker in the gutter on every line that calls something and a link on every call CodeGraph resolved. A long body shows its opening plus a window around every call site, with the skipped runs counted rather than hidden.
- Calls, on the right, one row per symbol this one calls, drawn level with the line that calls it and joined to that line by a hairline. Hover either end and the line, the gutter marker and the connector all light up. A symbol called from several lines says so;
createsmarks a constructor.
A class, interface, struct or enum shows its members in source order instead of a body, each with how many things call it and how many things it calls.
Under the source, a blast radius strip counts what a change here would reach: direct dependents, everything within three hops, and how many files, test files and routes that touches.
Honesty on screen
The viewer never presents a guess as a fact:
- Edges CodeGraph resolved by name alone, below its confidence threshold, fold into an "uncertain" line rather than sitting among the resolved ones. Nothing is silently dropped — the count is always there.
- A symbol that no test reaches within three caller hops wears a badge saying exactly that.
- Calls into symbols that aren't in the index are counted and marked, not omitted.
- A file that changed on disk since it was indexed shows a banner instead of source that may no longer line up.
Getting around
- Search with
/or Cmd-K: every symbol and file, grouped by kind, with signature andfile:line. Arrow keys and Enter, no mouse needed. - Entry points on the opening screen: your framework's routes, the files that run code when they're imported, and the most depended-on symbols in the project.
- A trail records the path you walked, with an arrow per hop showing whether you stepped into a call or up to a caller. Click any hop to jump back to it. The trail lives in the URL, so you can send someone the exact route you took.
- Keyboard: arrow keys move within a column, left/right switch columns, Enter follows, Backspace steps back.
Clicking any file path opens the file view: everything that file depends on, its outline in source order, and everything that depends on it.
The whole file
The Source tab on that screen replaces the outline with the file itself, top to bottom, with the same gutter markers and the same right-hand list of what each line calls — a 6,800-line file scrolls as smoothly as a 60-line one, and the text pages in behind you.
The margin on the left is the part you cannot get anywhere else: an arc for every call that stays inside the file, drawn from the calling line to the line the callee is defined on. Source order is the only layout — nothing is placed by an algorithm, because the author already placed it — so the shape of a file's internal call structure is legible at a glance. Hover a line to light the arcs the function under your cursor takes part in; click an arc to jump to the other end. On a file with more than forty of them the diagram narrows to the symbol you are reading rather than drawing a wash of overlapping sweeps, and the count stays in the header.
A rail on the far left lists the file's symbols and follows you as you scroll, when the window is wide enough for it.
The flow
Type "how does execute reach getFile" into the search box — or execute -> getFile — and the first result opens the Flow strip: the call path between the two symbols, left to right, one card per hop.
Each card is opened at the line that makes the next call, not at the top of the function, so reading the strip is reading the six or eight lines that actually carry the request. The identifier being called is a link; click a card's header to open it in the symbol screen with the trail already set to the path you have read so far.
- The link between two cards carries the edge — what kind it is and the line it was recorded at.
- A dashed link is a hop nobody can see in the source: a callback, an interface dispatch, a React re-render, a JSX child. It names the mechanism and, where the resolver knows it, the exact line the handler was wired at. This is the part grep cannot do.
- When a name means several definitions, the strip says so under the picture and names the one this path runs through — and offers the other paths in the picker at the top. Choosing "All paths" draws them as one diagram, branching where they differ and rejoining where they agree.
- "Not connected" is an answer, not a failure: a flow that runs through a dispatch no static edge records genuinely has no path, and the screen says that rather than inventing one.
The "Read as flow" button on the trail turns a walk you did by hand into the same strip. It is the same path finder codegraph_explore leads its answers with, so the picture and what your agent tells you cannot disagree.
The map
The Map tab (m) draws the project at module granularity — one box per directory — with dependencies pointing down. Nothing is placed by hand: a module sits one layer above whatever it depends on, so the top of the picture is what runs first and the bottom is what everything else stands on, and the same project always draws the same picture.
- Line weight is how many calls, imports and type references cross the link. Hover one for the breakdown by kind and the busiest symbol pairs behind it.
- Click a module to isolate its links and see its dependencies and dependents with counts, plus its files — click one to open the file view.
- Cycles are listed, not straightened away: mutual dependencies between two modules, loops of three or more, and circular imports between individual files.
It is honest about what it leaves out. Links carrying only a handful of references stay hidden until you select a module they touch, and references CodeGraph isn't confident about are excluded from every count on the screen — the panel prints how many. The vertical order rests on the dependencies your code writes down (imports, qualified names, inheritance, typed receivers), because a method name shared by two unrelated folders should not be able to move a box; when a project has too few of those to go on, the panel says the order came from raw reference counts instead.
The map opens on your project's source directory. The picker switches to any other top-level folder or the whole repository, the checkbox brings test modules in, and ?depth=2 in the address splits a large folder into its sub-folders — the useful setting on a monorepo. What you are looking at lives in the URL, so the view is shareable.
Options
codegraph ui [path] |
Read a specific indexed project instead of the current directory |
--port <n> |
Pin a port. Without it the viewer takes 4747, or the next free one |
--no-open |
Print the URL instead of opening a browser (headless boxes, SSH) |
CODEGRAPH_BROWSER=<command> |
Choose which browser opens. CODEGRAPH_BROWSER=none never opens one |
codegraph web is an alias for the same command.
Privacy
The viewer listens on 127.0.0.1 only, so nothing on your network can reach it, and requests claiming to come from any other host are refused. It is read-only: it opens an index that already exists, never creates one, and never writes to your project or your graph.
It sends nothing anywhere — no code, no paths, no analytics. The page in your browser talks only to the server on your own machine, and that server makes no outbound connections at all. See Telemetry for the complete picture.
The viewer reads an index that already exists, so run codegraph init in the project first.